No Comments

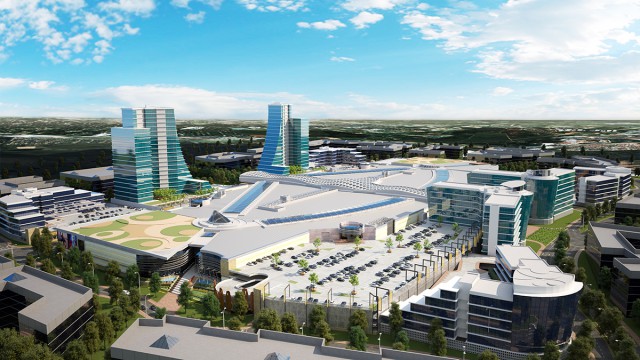
Mall of Africa: How the New Giant Stacks Up

Article originally appeared on Moneyweb (21 April 2017)

How does the new kid on the block measure up on one key metric?


Nearly one year after opening, just how well is the Mall of Africa trading? Developer and manager Attacq stated in February that “trading densities exceeded expectations”.

The country’s largest single phase shopping mall, which opened on April 28 2016, “achieved more than 1.1 million visitors per month” through last year. In what could be considered rather limited disclosure, Attacq said a “monthly average trading density of R2 777 per m2” was achieved. Trading density, which measures the the turnover achieved per square metre, is a critical metric for retail. Expansions aside, this is how stores and shopping malls grow: by attracting more shoppers (and better quality range/tenants).

Annual trading densities of selected shopping malls

Nelson Mandela Square₁ R65 043 / m²
Sandton City₁ R52 715 / m²
Hyde Park Corner₂ R50 784 / m²
Canal Walk₂ R43 464 / m²
Somerset Mall₂ R42 156 / m²
Brooklyn Mall₁ R37 644 / m²
Eastgate₁ R37 622 / m²
Clearwater₂ R37 308 / m²
Willowbridge₂ R35 976 / m²
Mall of Africa₃ R33 324 / m²
Rosebank Mall₂ R33 276 / m²

1 12-month average (to 31 December) as published by Attacq and Liberty Two Degrees

Annualised from Hyprop H1 results to 31 December 2016.

Annualised from monthly average provided by Attacq for Mall of Africa since opening (eight months).

Sources: Liberty Two Degrees, Hyprop and Attacq financial reports

On a headline level, Mall of Africa is lagging direct super-regional rivals like Sandton City, Canal Walk and even Eastgate. However, these figures need to be seen in context: the Mall of Africa is a brand new development.

One (albeit not 100% precise) comparison, based on publicly disclosed data, is with Rosebank Mall which underwent a major R1 billion redevelopment in 2013 and 2014. It is about half the size of the Waterfall giant, with a total retail gross lettable area (GLA) of 62 413m2, versus Mall of Africa’s 131 000m2(although, based on Attacq’s reporting of its 80% share as at December 31, the primary GLA seems nearer to 123 000m2).

The Rosebank Mall achieved an average monthly trading density of R2 738m2in the six months to December 31 2015. This aligned almost perfectly with the reopening of the substantially bigger (and completely developed) mall. That reported trading density was a 33% increase on the prior period (when the centre was effectively a giant construction site). On an annualised basis, the trading density soon after reopening translates to R32 856m2. One wonders just what expectations Attacq had set for Mall of Africa.

Also, when it comes to malls, not all trading densities are created equal. Certain sizes of malls and categories of tenants will generate different trading densities.

In an extraordinarily detailed trading statistics and supplementary information document, Liberty Two Degrees, with stakes in Sandton City, Nelson Mandela Square, Melrose Arch and Eastgate (among other assets) provides colour on trading densities achieved at its malls. In the accessories, watches and jewellery category, Nelson Mandela Square achieved annual trading density of R253 052m2 (with 5.6% of gross lettable area), while Sandton City reported a figure of R212 991m2 (only 2% of GLA). Food services, which makes up 36% of GLA in Nelson Mandela Square, had a trading density of R55 552m2, while in adjoining Sandton City it was slightly lower at R52 802m2 (3% of space).

Data for malls such as Menlyn Park and Tyger Valley (both owned by PIC property arm Pareto) and Gateway Theatre of Shopping and Cavendish Square (both Old Mutual Properties) is not publicly available. Surprisingly, few other property funds with large retail portfolios, including Growthpoint, disclose specific trading densities of their assets. All Growthpoint will say about performance of the V&A Waterfront, in which it holds a 50% stake, is that it has the “best trading density compared to other super regionals in [the] country”. This would suggest it is easily over the R50 000m2 (annualised) mark.

For Attacq, key to growing and sustaining footfall during the week at Mall of Africa will be the completion of office and residential developments in Waterfall. In its H1 results to December 31, it says “trading is expected to increase as Waterfall City and its surrounds continue to densify, extracting further value from Mall of Africa in the years to come”.

The mega developments of new head office campuses for PwC (45 000m2) and Deloitte (43 000m2) will certainly help. These two projects alone will bring an additional 7 000-plus employees to within walking distance from the mall. The incredible development in the Sandton CBD, especially surrounding Sandton City, means it will take decades for Waterfall to achieve the same densities its Sandton rival enjoys, and it’s not clear that it ever will….

No Comments

Demand for Green Buildings: Tenants, Investors Push

Article originally appeared on Moneyweb (2 January 2017)

Real estate developers must keep pace with tenants’ green demand, with respect to both existing and new leases.


Real Estate developers are gradually recognising the importance of green buildings in enhancing tenant attraction. Both tenants and property owners have started including elements of sustainability in leases. Commonly referred to as green leases, they include an upfront establishment of sustainability goals and allocation of implementation responsibilities between the owner and the tenant.

The challenge here is inclusion of clauses to deal with non-compliance on either side, which is yet to become a common practice.

Also, it is relatively easier for landlords and tenants to include green features in new leases than it is to retrofit them into existing leases or renewals. The large publicly traded retail tenants are the ones that are forcing more sustainable features in buildings and more efficient management.

Sustainability is becoming an important influencer in the design of overall business strategy of tenants. According to a 2013 United Nations Global Compact’s Global Corporate Sustainability report, approximately 63% of the respondents are aligning their core business strategy to advance their sustainability goals.  For this, real estate developers, on their part, need to keep pace with tenants’ green demand, with respect to both existing and new leases. Increase in tenant collaboration will likely result in improved satisfaction and subsequently retention.

In lieu of an effort to do more with fewer resources, tenants are becoming increasingly efficient about usage, which expands from the physical space (square footage) to its utility. They are re-evaluating their physical space to save costs and also enhance the softer benefits at the workplace.

Leading African businesses, and multinational organisations are now shifting their thinking from “how much will green building cost my business” to “how much will not investing in green building cost my business.”

While determining this, companies are considering the positive impact of sustainability measures on employee absenteeism, productivity, and well-being. Certain design attributes of a green office building enhance occupant health and well-being, therefore resulting in healthier, happier, more satisfied, and ultimately more productive workers.

Further, tenants want to meet their corporate environmental and social responsibility goals. For this, tenants need to track, measure, and include data related to utilities consumed in their leased spaces. Hence, leasing decisions are increasingly influenced by green building features that result in improved productivity and investor interest and are effectively tracked and measured.

According to the Global Real Estate Sustainability Benchmark (GRESB), investors are increasing their focus on integrating real sustainable practices into their existing and new investments due to the favourable impact of sustainable factors on both risk and returns.

Investors are setting goals to improve the environmental performance across their portfolios through lower carbon emissions, improved energy efficiency, better utilisation of water and other resources, and superior waste management. To effectively pursue and achieve these goals, investors encourage companies to increase transparency and effectively disclose information related to sustainability performance.

In summary, with tenants’ business performance increasingly evaluated on a non-financial basis — not just by their customers, but also by investors — the focus on sustainability implementation and measurement of leased space is only going to increase.

We believe it is only a matter of time before sustainability implementation and compliance requirements are made more stringent across various nations and geographies.

No Comments

SAPOA Operating Cost Report April 2017

Article originally appeared on Property Wheel (24 May 2017)


Key findings:

  • For the year ended December 2016, all property operating costs equated to 34.4% of gross income. This is down 60bps from December 2015 but well off the highs of 2011 when a gross cost to income ratio of 37.5% was recorded at an all property level.
  • Of the three major sectors, industrial property was the only on to report an increase in its cost to income ratio – a 230bp increase to 32.0% over the twelve months to December 2016.
  • The office and retail property sectors both reported improvements on the previous December’s cost to income figures.
  • Municipal charges – comprised of rates and taxes, electricity and other utility charges – continues to drive the overall increase in costs. As a cost category, municipal charges accounted for 63% of total costs as at December 2016.
  • Over the years, municipal charges have increased at a significantly faster rate than the other cost categories – becoming a bigger slice of a bigger pie in the process.
  • On a sector level, industrial property’s municipal charges make up the largest percentage of total costs at 72.8% – followed by retail and office with 62.5% and 61.1% respectively.
  • The office sector currently has a higher weighting in repairs/maintenance/tenant installation with a contribution of 10.7% to the overall cost line – higher than retail & industrial.
  • Retail property currently has a higher weighting to the Management & Leasing Commission category.
  • Overall operating costs increased by R5.28sqm per month for the year ended December 2016. The biggest driver of this increase was Municipal Charges (+R4.8sqm). Municipal charges are comfortably the largest cost category at R33.34/sqm with the rest being roughly equally split between the other major cost categories.
  • As a percentage of gross income, retail property segments are seeing the highest level of operating costs on an aggregate sector level.
  • Small retail segments such as Community  (12 – 25k sqm) and Neighbourhood (5 – 12k sqm) centres are reporting levels in the low 40%’s – a function of higher vacancy rates and rental incomes that are growing slower than costs.
  • Prime offices are amongst the best placed segments with regards to operating costs as a percentage of gross income at 29.9%.
No Comments

Real Estate Investments in South Africa increased by R28 billion

Article originally appeared on SA Commercial Prop News (25 April 2017)

Investment volumes in South Africa’s real estate saw a 55,2% increase in 2016, despite economic challenges, weak currency and political uncertainty.


Real estate consulting firm, JLL SSA, has released its 2016 Investment Review of the South African property market with analysis reporting a R28.8bn increase in investment, from 18,5bn in 2015, and a similar 52.8% increase in gross lettable area (2 million square metres).

Whilst portfolio sales contributed notably to this value, (key portfolio deals included purchases by Tradehold, Imbali Properties, Delta and Mendo) investments still grew by an exponential 28.0% if the Tradehold is excluded.

South Africa’s property market saw a 55,2% increase in investments in the 2016 period, despite challenging economic conditions.

JLL SSA Head of Research, Zandile Makhoba reports that the investment growth in 2016 is the highest the company has seen in the past five years, which is interesting in the light of the perceived over-supply amongst developers in the market.

Total Investment Transactions Value by Property Sector


“This is a good reflection of investors seeing value in existing fixed assets, as well as long term confidence in the economy.  It must be noted that on closer inspection, we have seen a slowing in greenfield investments over the past few years. For instance, the growth in new commercial building plans has reduced from a peak of 25% in 2012. This is considered a mitigation against a potential over-supply which could stifle rental growth as investors look to upgrade existing buildings and improve their value, rather than to break new ground adding new lettable area to existing stock,” she said.

Total Investment Transaction by Province

From a geographic perspective, Gauteng continues to dominate activity, accounting for 50% of the total investment value in the year. However, KwaZulu-Natal and Western Cape showed stronger investment growth, both more than doubling the investment levels of 2015.  Industrial activity dominated KZN’s growth.

In the commercial office space, investments continued to show healthy growth in 2016. A total of R8.3 million was invested in existing office stock, a growth of 8.9% on a y/y basis.

Makhoba comments that KZN recorded the most growth in the year with sales more than doubling at R781 million. The rise was largely driven by the Tradehold portfolio purchase from Collins Property Projects, she says. Then in the Western Cape, demand for investment property has been on the rise, with the City of Cape Town attracting both local and international occupiers. “Office investments are highly valued given the region’s potential, with the result that investors have adopted a hold-everything strategy in the city.”

On the retail front, in 2016 there is compelling evidence of transactional interest returning to key metros, after three years of growth outside the major metropolitan areas. 83 retail properties – the highest number of recorded deals since 2011- ranging from community to small regional malls were transacted in 2016. “Overall investment value amounted to R7.18 billion in 2016, with the Western Cape passing the R1bn mark with a value of R1.39 billion in investments in the year”, says Makhoba. Three high quality transactions contributed to most of this value, including Eden Meander, Makro Cape Gate and Somerset Value Mall. Makhoba also reports it was a year for buyers with the average purchase price for retail investment properties declining from R12, 982/m2 in 2015 to R9, 054/m2 in 2016.

The report confirms a notable increase in 2016 industrial investment activity. “It was the only asset class to record double digit growth in completed new builds at 14%”, says Makhoba.  It also saw a 25% increase in number of industrial accommodation transactions. It is worth noting that there was major growth in interest in Eastern Cape properties, accounting for 44.4% of transactions in the other province’s category (excluding Gauteng, KwaZulu-Natal and Western Cape). This further emphasises the growing potential within the industrial sector. Another point of interest is the potential for brownfield investments in this asset class. Makhoba says that relatively lower building costs and the potential to expand and upgrade industrial properties is an investment opportunity, given the growing preference for maxi-unit accommodation. This is even more important in areas with limited or expensive land options such as Gauteng, KwaZulu-Natal and Western Cape.

Looking ahead, whether buying or selling, investors remain conscious of the economic climate which could affect their investment returns. Although forecasts for GDP show an improvement in the next three years, with the National Treasury anticipating a 2.2% growth rate by 2019, these levels are insufficient to stimulate significant employment growth, with far reaching implications for the broader economy.